As the year draws to an end, it is time to look at the global container shipping trends to get an overview of the market situation in the last year and prepare for the coming season. Our news for today is a special report about the international container shipping trends as suggested by Globalia’s media partner Container xChange– the largest marketplace for container leasing and trading.

A look at the container prices
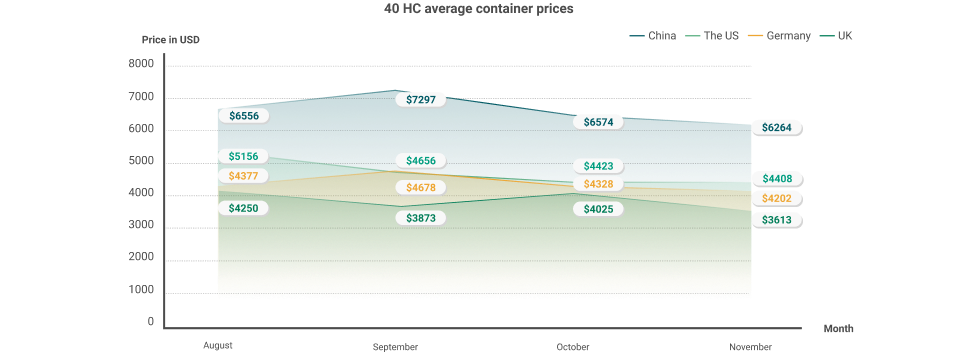
A look at the important ports in the US, UK, China, and Germany shows a downward trend in container prices between August to November. Container prices in the USA have reduced by almost 15% in the last 3 months. To quote Johannes Schlingmeier, the Container xChange Co-founder, “Over the last two quarters, the industry has faced skyrocketing container prices. However, these increases first leveled off and have now started gradually decreasing. It seems, what we’re seeing now, is a turning point.”

The largest drop in container prices can be noted in the Port of Qingdao from September to November. In this port, the average cost of 40 HC containers went down by over 23% amounting to around $1756. On the other hand, in the Port of Ningbo, a 40 HC container cost $959 less in November compared to September.
Explaining Container Availability Index
The CAx (Container Availability Index) is an index (a tool) that allows interested parties to monitor the availability of containers in certain ports through the import and export moves of full containers. A CAx value of 0.5 means that the same number of containers leave and enter a port in the same week. CAx values of > 0.5 means that more containers enter and CAx values of < 0.5 means more containers leave a specific port. The CAx is calculated based on the tracking data of millions of containers. The data is collected from shipping lines, depots, and terminals.
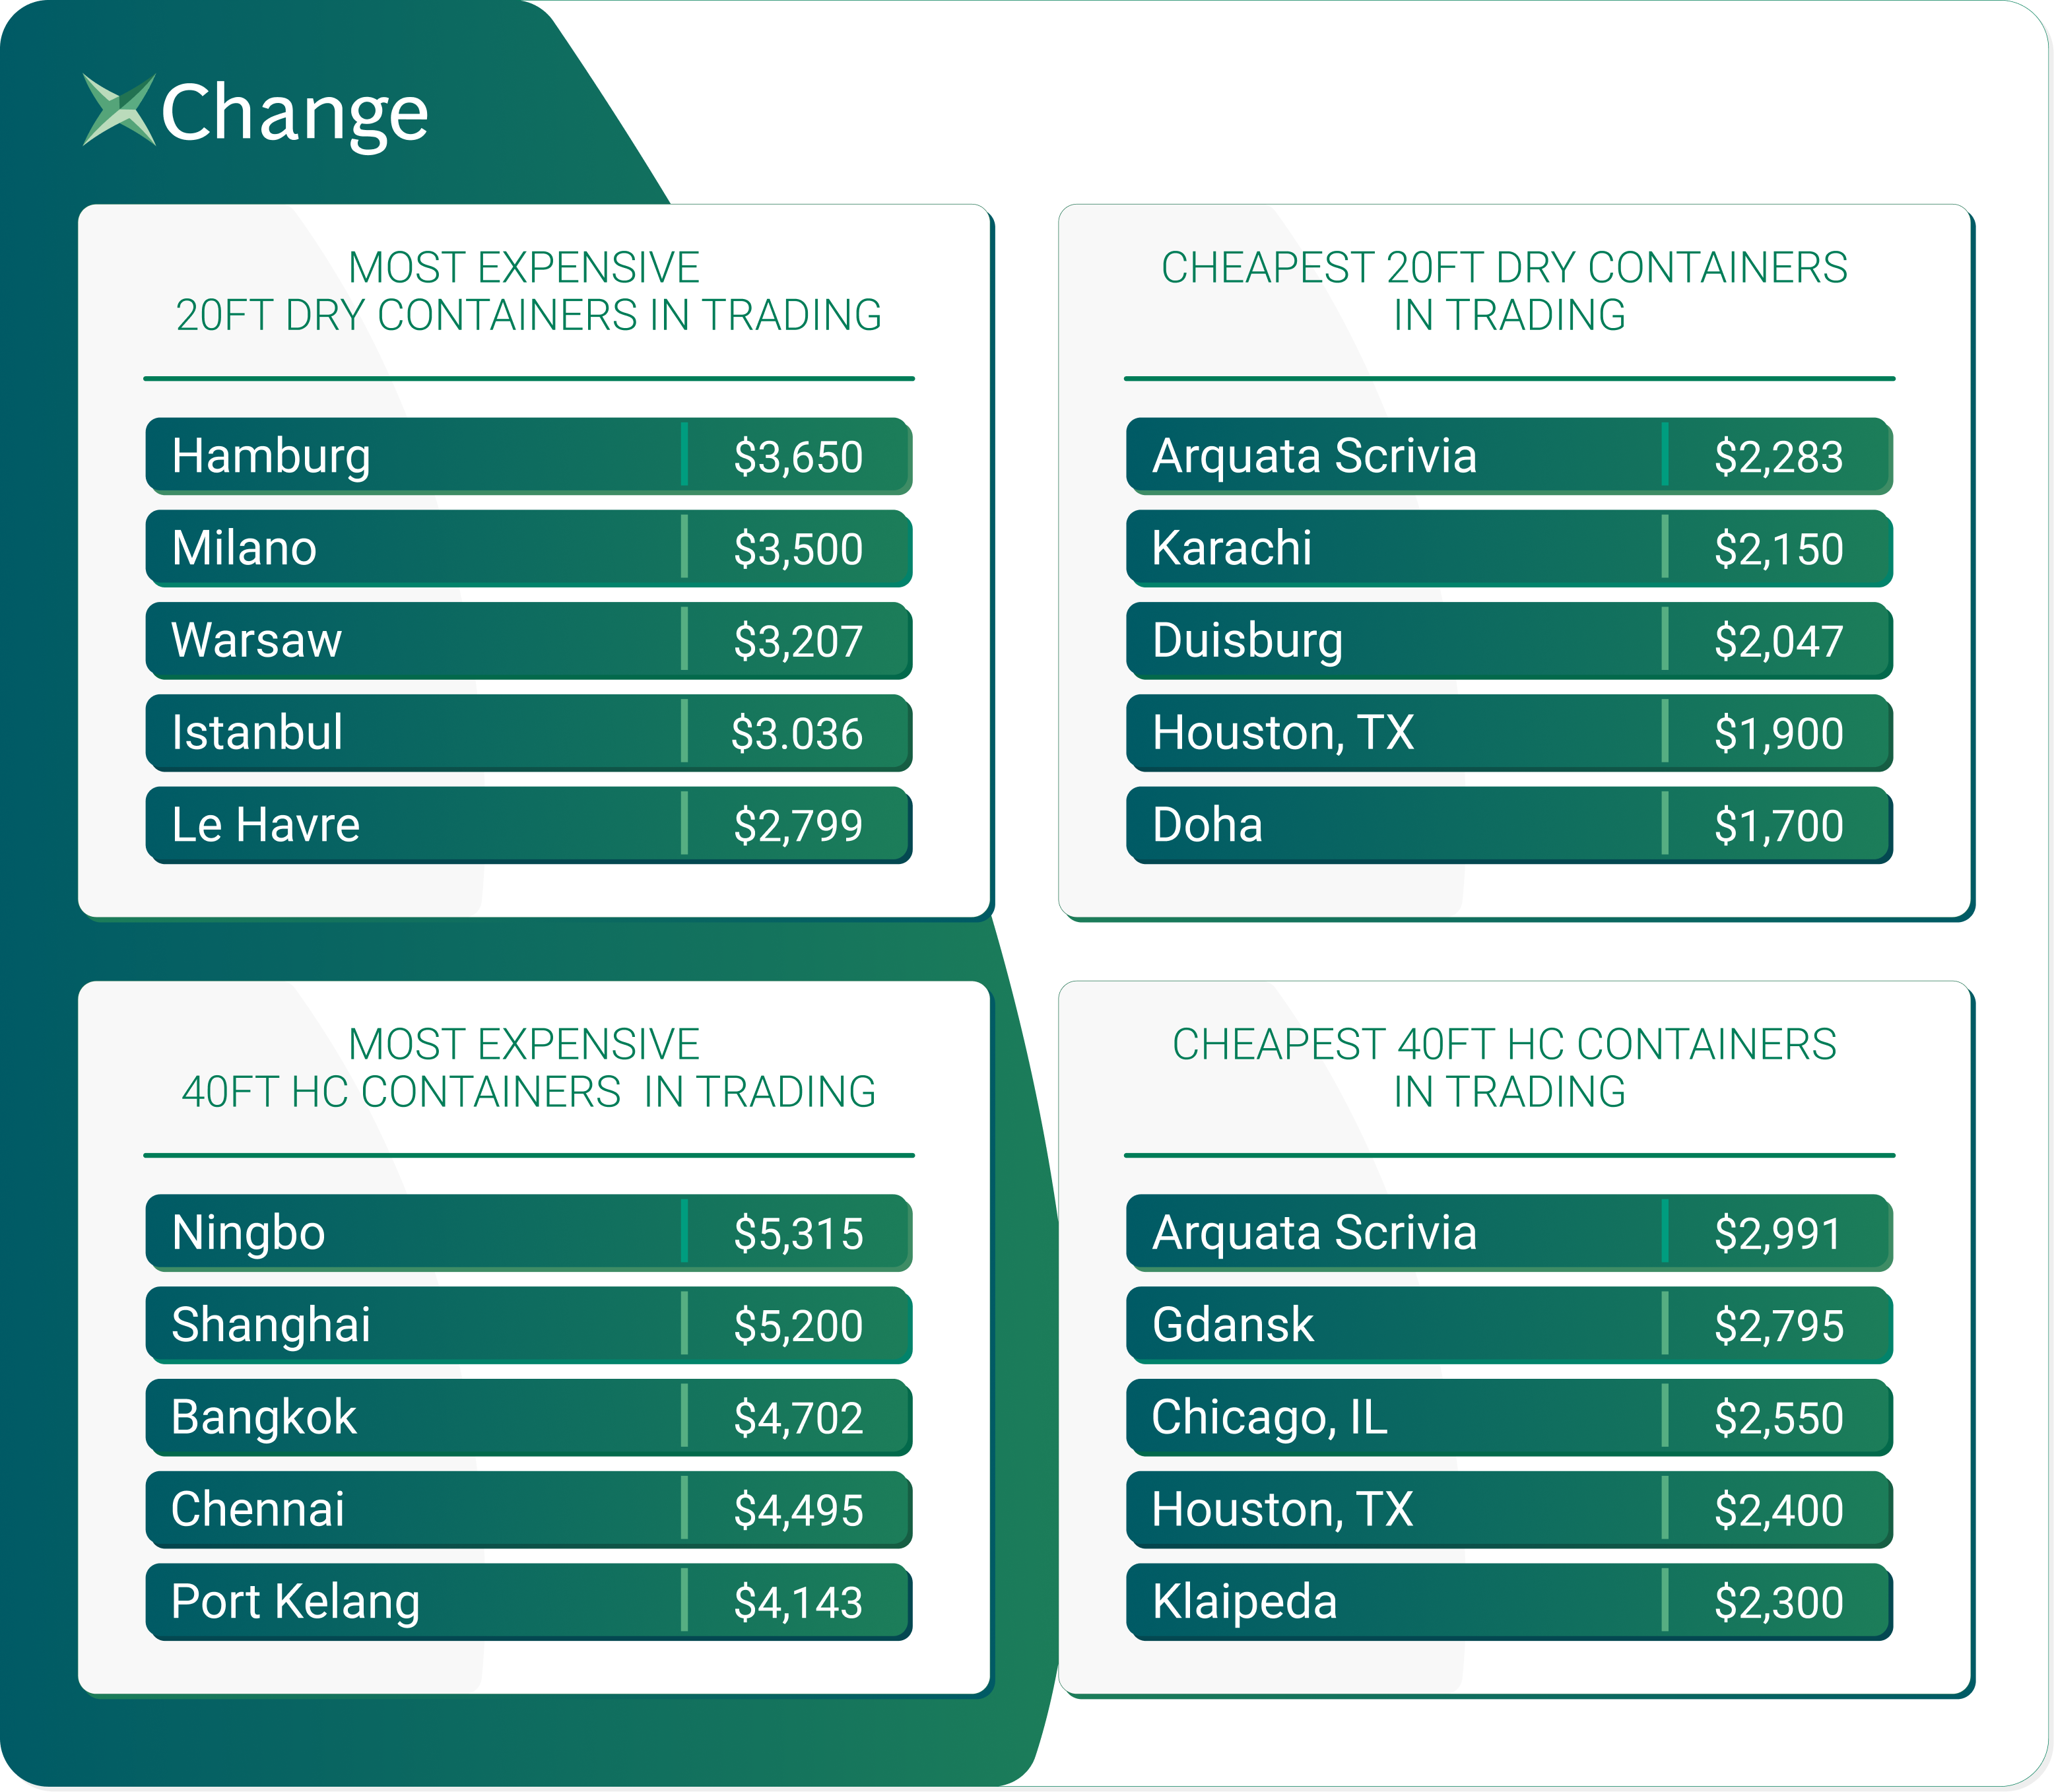
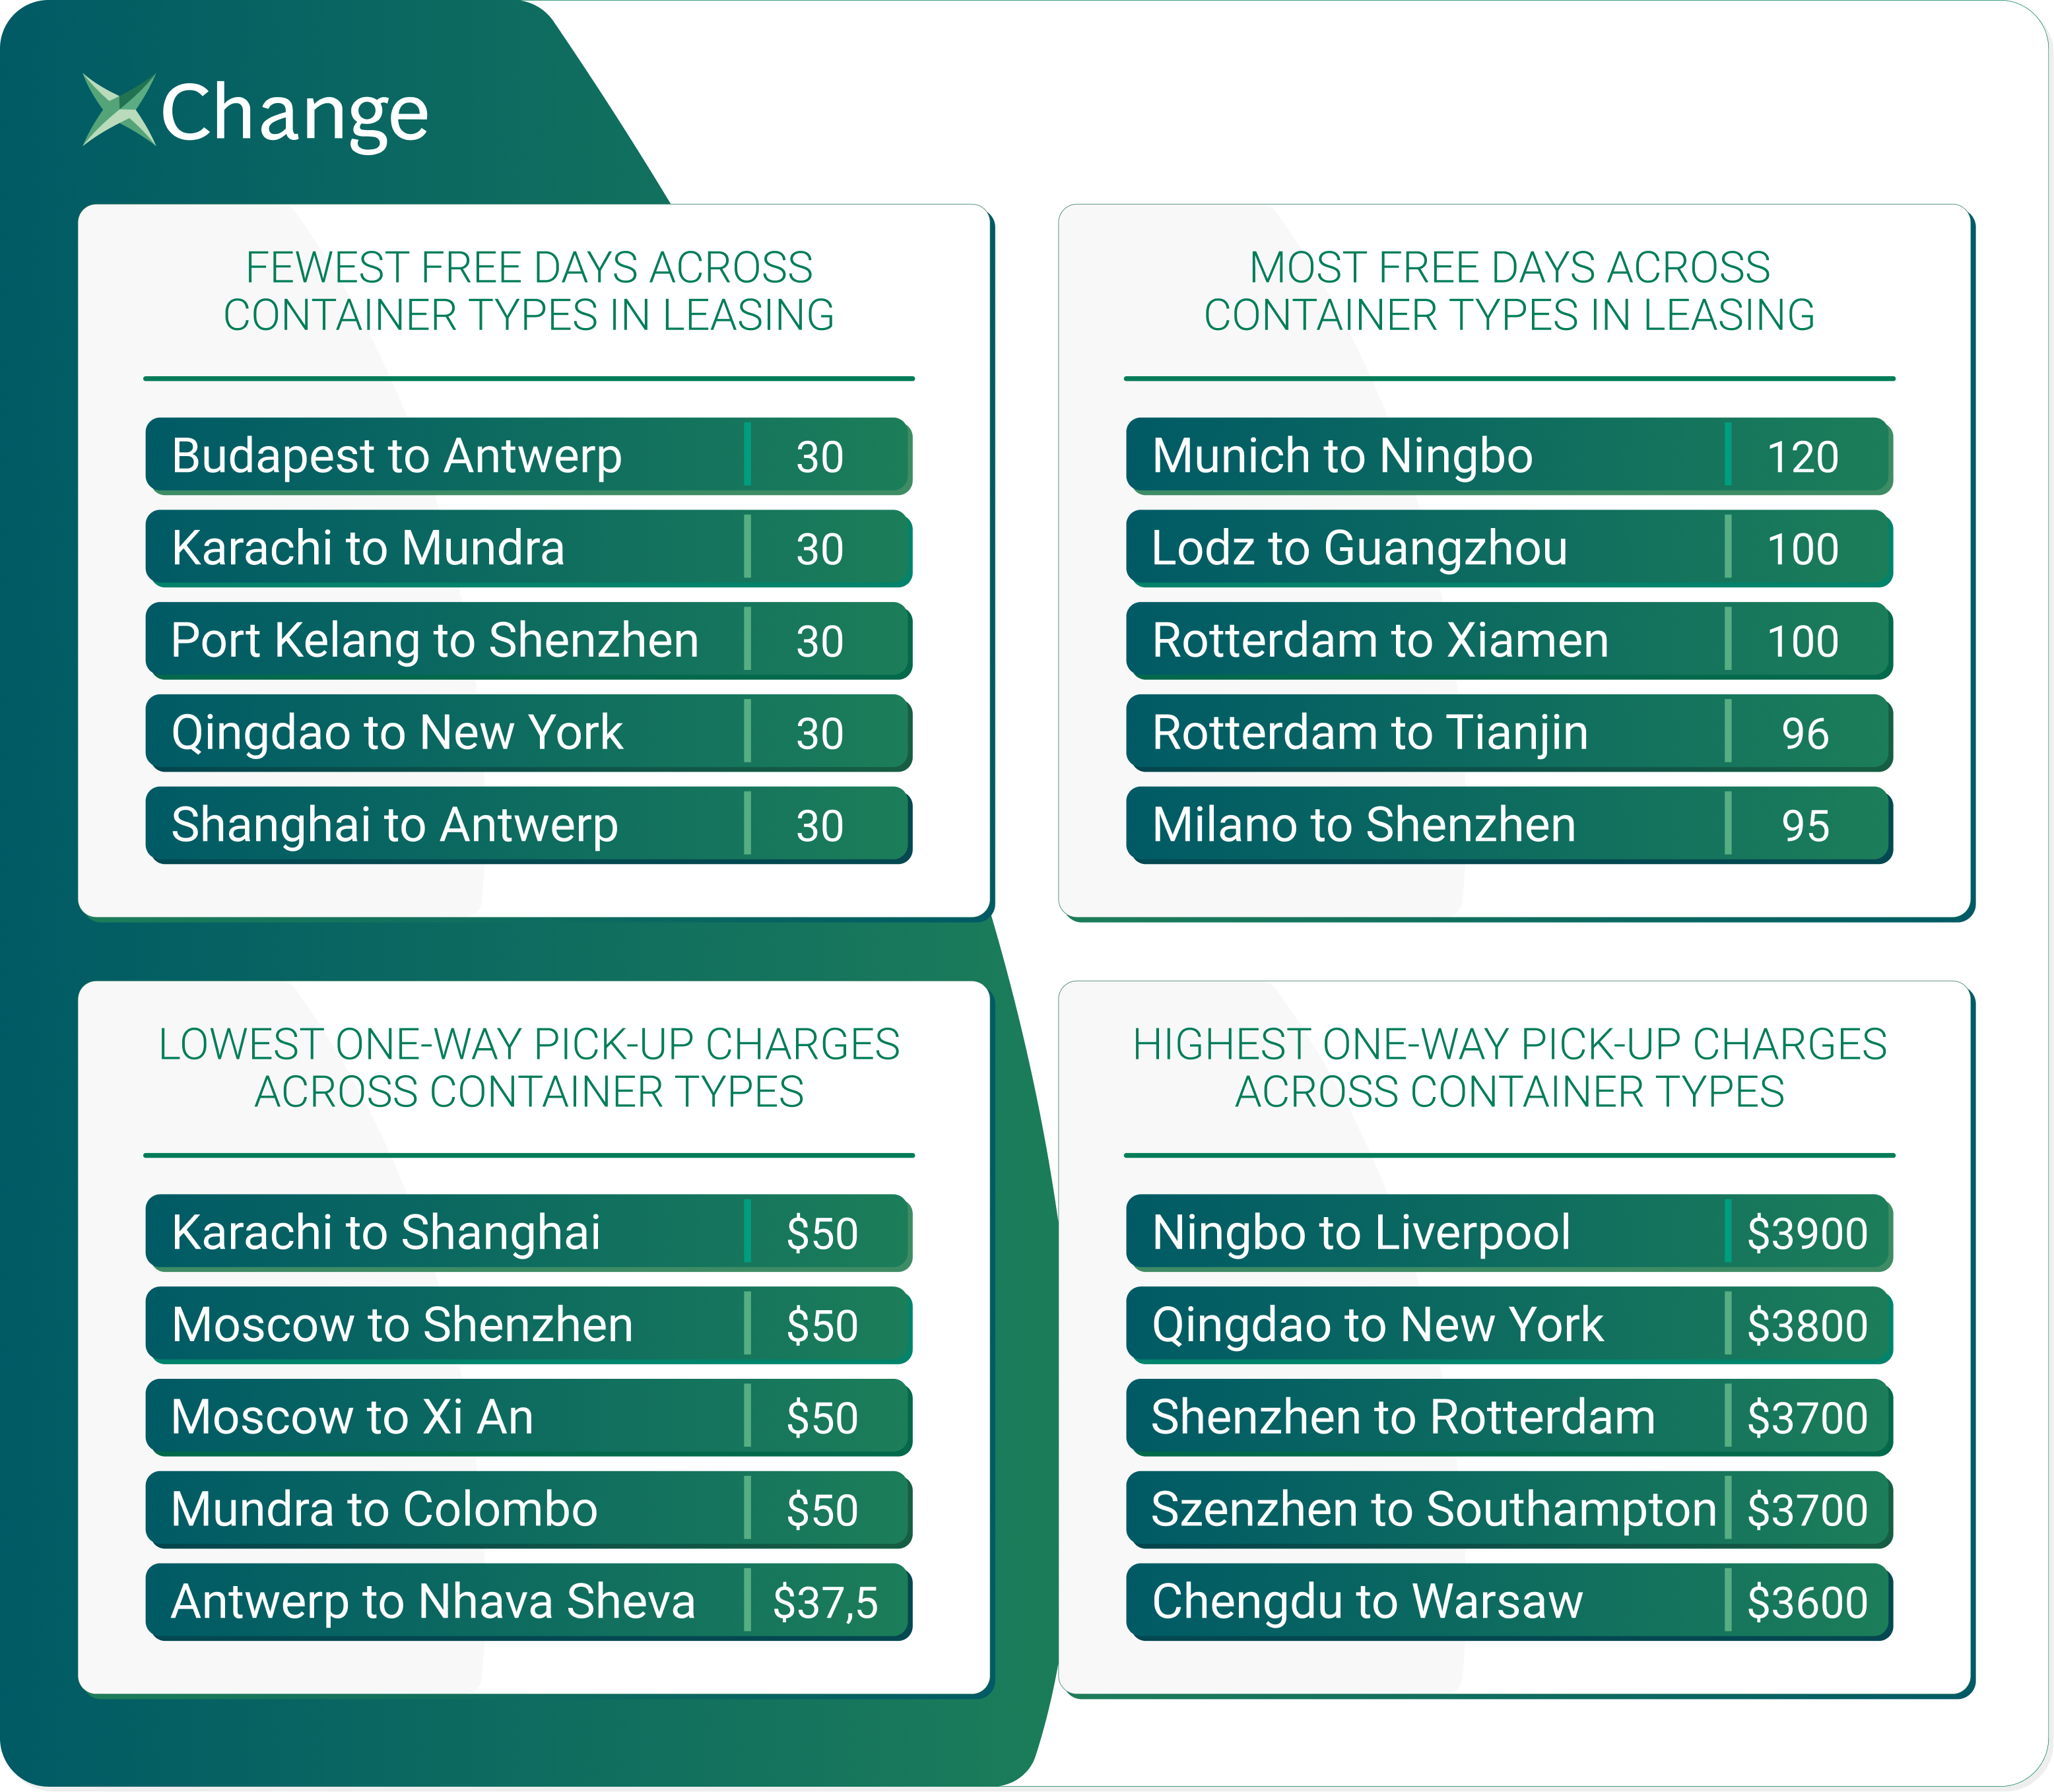
The Leasing and Trading Rates of Containers
 |
 |
Inbound containers are piling up in ports across the world
The Container xChange research took into account 83 major ports spanning the globe. However, out of these 83 ports, only 9 ports have CAx values lower than 0.50. The CAx values were more than 0.50 in 74 ports. In 2020, 61 ports had CAx values lower than 0.50 while in 2019 just 34 ports had CAx values less than 0.50. This demonstrates how the pandemic disrupted the normal functioning of ports. Generally, the Christmas season sees a surge in containers in North America and Britain while the ports in Asia register a drop in container volume. However, presently, just a few Chinese ports have a lower CAx value while the rest of the ports have greater CAx values. This suggests that containers around the globe are either delayed or stranded.
A look at the regional trends in container shipping
A drop in leasing rates in China
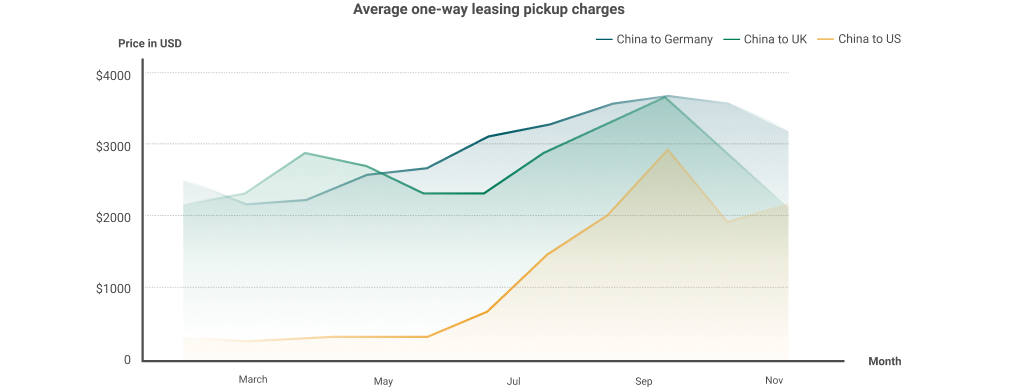
The average one-way pickup rates Ex China to Germany and the UK have reduced between September to November. This rate will further drop in the coming months. The average one-way pickup rate from China to the US has gone down by 25% between August to September. However, this rate has increased in October and November.
A fall in container prices since September
There has been a fall in the prices of 40 HC containers across 14 Chinese ports. Moreover, this same trend can be noted for 20 DC containers as well. Average container prices went to an all-time high in September. Since then the price has been falling till the last week of November. In Shanghai, the cost of 40 ft HC containers went down by 21% from $6,686 in September to $5,746 in the first week of December. In Yantian Port, this drop was around 12%, in Tianjin Port 16%, in Shenzhen around 7%, in Dalian 11%, and in Qingdao 23%.
China Container inbounds ratio highest since 2019
In November 2020, Shanghai Port saw the biggest decline in CAx values that reached a rock bottom 0.05. In 2021, on the other hand, the CAx values went down to 0.50. This implies that the number of containers arriving and departing from the ports is the same. In Yantian Port, the average CAx value of 0.27 demonstrates that the number of outbound containers is greater than before but still not at the pre-pandemic level.
CAx values are higher in Shanghai and Tianjin than in Ningbo and Qingdao
The CAx value at Ningbo has increased substantially than in previous years. It is now gradually going back to the pre-pandemic levels. In 2020 the Port of Qingdao saw a massive drop in the CAx values. In 2021, the drop in value is considerably less. This implies that in November 2020, the number of inbound containers was lesser than that of outbound containers. In 2021, the outbound containers were not greater than that of the inbound containers.
CAx values at Tianjin and Dalian Ports
The CAx values at Tianjin were greater than that of Ningbo and Qingdao ports in November 2021. At the 48th week of this year, the CAx values were around 0.71 while last year it was 0.16. Before the pandemic started, this value was 0.39. Therefore, it shows that there are more inbound containers at these ports. In the Dalian Port, the average CAx value was 0.49 in November that is 4 times greater compared to 2020.
Container shipping trends in India
In Chennai, the cost of 40 ft HC containers has reduced from $5550 in August to $5323 on the 1st of December. In Nhava Sheva Port the price for the same has dropped from $5044 in October to $4875 in the first week of December. The price for the same before the pandemic was around $1000 for 20DC and $2000 for 40DC. The Chennai Port witnessed a 17% jump in average prices of 20 DC containers. In the Nhava Sheva Port, the average container price rose from $2292 in October to $2320 in November
The container availability is not likely to increase in 2022
In the Nhava Sheva Port, the CAx values were more or less stable at 0.78 in October end. In the last two years, this value was lower demonstrating a downward trend till the year ending. This implies that a greater number of outbound containers were recorded at the Nhava Sheva Port during this time of the year. However, this year the trend is not the same. The figures show that there has been a decrease in exports. Moreover, containers have also piled up at the ports and the number of inbound containers is higher than before.
The CAx value at Mundra Port was 5 times higher compared to the same time in 2020. Moreover, it is 3 times higher than that of the pre-pandemic level. This has been a consistent trend all around the year. At Chennai Port, the CAx values on the 48th week of the year are twice that of 2020. The pre-pandemic trend at this port was decreasing CAx values, because of higher exports. However, this year shows an opposite trend of increasing values till the end of the year.
The situation in Europe
CAx values rise at ports in Europe, heavy container inbounds
The Port of Antwerp recorded a 5 times growth of CAx values in November compared to last year. It goes without saying that a greater number of containers are docked. At the Port of Hamburg, the CAx values are more than three times higher than 2020. The average CAx values at the Port of Felixstowe were 0.65 in the past 3 years, but at week 48 this year, the values are 0.89. CAx values at the port of Valencia are 6X from the last year. The CAx value at the Port of Sines was 0.09 in 2020, while it is 0.85 this year. This is a massive increase. Port of Barcelona also has double the CAx values than 2020.
All the ports in Europe have higher CAx values than 2020 and 2019. Moreover, the concentration of CAx values is in the CAx range of 0.63 – 0.89 which indicates the consistent presence of more inbound containers than outbound containers.
Container availability in the US
The number of inbound containers is higher in the US
In 2020 the CAx values at the Port of Los Angeles dropped from 0.85 to 0.34 in the first week of November to last week of November. This year it has dropped from 0.88 to 0.87 in the same time of the year. At the Port of Long Beach, the CAx values ranged between 0.86 to 0.89 since week 31. In November, this value is at 0.86 and similar values will continue till the end of the year. Even though we’ve noted a drop in these values last year in 2020, the forecast is not showing signs of revival this year due to the current situation of the gridlock.
The CAx values at the Port of Savannah was steadily high all though this year. It ranged between 0.90 and 0.96. This suggests tremendous port congestion and container load of inbound shipments.
The CAx values at the Port of Houston, Texas, in 2020 was half of this year. In November, the CAx at Houston Port was 0.89 while in 2020 it was 0.48. Undoubtedly, the port witnessed an increased burden of inbound containers all though 2021 as compared to 2020 and 2019.

